Thermal analysis over district heating networks
District heating is widely used, by both commercial and residential consumers, and it is one of the most economical ways for cities to reduce their carbon emissions. The heating agent is either hot water or steam, which is distributed via an underground pipe network.
Given that in many countries the heating networks are even 50-60 years old, there are high chance of them suffering from energy leakage due to old insulation, corrosion, and motion in the ground. There are cases when large quantities of heating agents are leaked, and because the pipe network is in general underground, it is very difficult to precisely detect if there is a leak or where the leak is. These major leakages can have a great environmental impact, as the ground can collapse due to erosion in the areas where it is exposed to large amounts of water at boiling temperature.
The manual searching for leakages is possible, but it requires digging up the pipes for inspection, an operation which has high costs involved, especially in situations when the leakage was not found and the digging has to be done repeatedly until it is located. For large-scale monitoring operations, a viable option for district heating monitoring is an aerial survey using high-end thermal cameras.
The work is done in different steps and provides different products that are ready for the CAD and GIS system of the energy provider and the city:
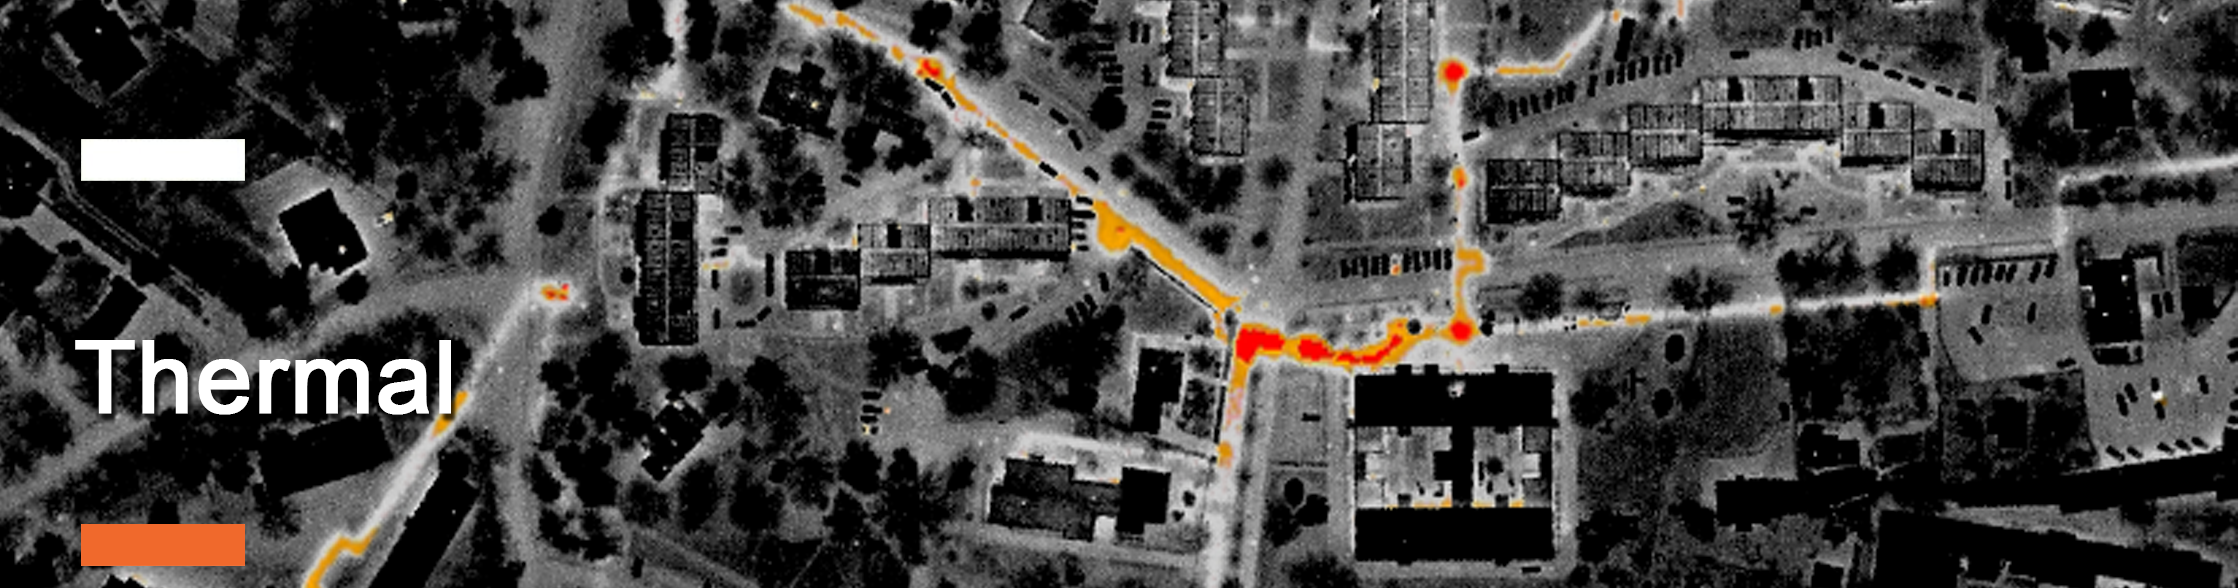
1. Thermal map of the city
The flight is approximately 600 to 800 metres above ground and thermal images are acquired during nighttime or early morning hours. The thermal images are georectified, using for this the GPS and IMU measurements simultaneously taken during the flight and mosaicked to a complete thermal map of the city.
2. Checking the Maintenance status
Based on the same time collected Lidar data, buildings, and other objects are eliminated from the analysis. Given GIS data on the existing pipe system to classify the insulation performance of pipeline segments. This can be used for the separation between old and new pipes.

3. Detect Leakages
The detection and classification of leakages can be done automatically. Extreme surface temperature induced by the underground leakages means that it is possible to model the temperature field and heat flux around a buried heating pipe and predict the temperature profile at the surface level. False alarms through vehicles, pedestrians, insulation faults in roofs, and animals are eliminated by using the Lidar data. Previous knowledge about thermal signature detection can be used to identify changes in the pipeline system. The resulting map contains an information layer on the location of the district heating pipe network and of the location of detected leaks – GIS-ready.
4. Estimating the hydraulic efficiency of the network
No matter how good the insulation is, there is usually some heat loss from the lines. Although different surface types will mask the thermal trace to a different extent, the thermal contrast between active lines and the surrounding ground is usually good. By overlaying a mask of the district heating network on top of the thermal map, we may identify inactive pipe sectors, and produce a real map of the network for hydraulic modeling to improve the efficiency of the network.