Airborne Remote Sensing: Complex mine survey for exploration, operational mine management and environmental monitoring
Objectives:
With lower prices of commodities costs of exploration and operational mine management are under constant pressure. Remote sensing technologies are one tool to reduce costly fields, speed up the exploration processes, and reduce the target areas for ground sampling and drilling in the exploration work.
Airborne remote sensing data are also providing regular updates on the topography, mining progress, and environmental monitoring of the mine operations. Furthermore, social responsibility and the integration of the local community into the mining activities can be supported.
For a prospecting area of more than 1400 sqkm with an active open pit/ underground mine site for Gold near the African rift valley, a complex survey was requested. The task was to support during the survey all parts of the mine operations from the exploration to environmental tasks by using Dimap’s multisensory approach and allowing costs saving effects in the different departments of the mining operation. The survey results should be included in the GIS- and Management system and have to be available to all departments in the required level of detail.
Technical realization
Dimap mobilized the eastern Africa platform for the multisensory operations from Nairobi to Tanzania. The Airborne Remote Sensing Platform consists of:
- Full waveform Lidar Riegl Q780 with a strike frequency of 400 KHz and 2cm shot-to-shot accuracy.
- Digital camera Hasselblad 50 Mpixel with calibrated 50mm lens.
- Reflective Hyperspectral sensors Hyspex VNIR1600 and SWIR320me.
- Thermal Hyperspectral Sensor Hypercam LW.
All sensors were used simultaneously in the air.
The aircraft had a high-precision GPS/INS system and a full waveform Lidar system installed. The flying altitude was 900m above ground, a compromise between data resolution, the strong haze, and the economy of the flight operations. The spacing between the lines was 300m. In total 175 lines were flown and 12 TB of raw data was collected. The instruments provided:
- The Lidar provided height information for terrain and vegetation analysis based on 8 points per square meter.
- The camera was providing images with a resolution of 8cm.
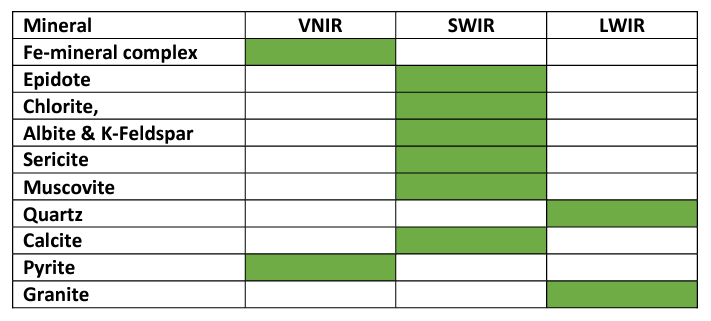
- The hyperspectral scanners covered the VNIR (400 to 1000nm with 160 bands, 1m resolution), the SWIR (1000 to 2500nm with 256 bands, 2.5m resolution), and LWIR (7800 to 11800nm with 120 bands, 2.5m resolution).
After a coverage check in the area based on the Lidar sensor, all data were processed in the Dimap facilities using 25 survey ground control points provided by the mine surveyor to assure the spatial accuracy of all datasets. Data were processed semiautomatic with manual quality control and according to given target mineral lists. Outputs of the production were digital terrain and surface models, contour datasets, orthophotos, thematic mineral, and environmental maps – all data coreference in UTM37S Arc1960 as a local system.
Results
Exploration support
For the exploration, the main goal was to speed up the exploration of new deposits based on the remote sensing data and the experience of the local exploration crew. The fusion of Lidar and hyperspectral was seen as the main tool. The Lidar data provided beside the DTM also information on fault line structures, the surface hydrology model, historic mining activities, and artesian mining areas.
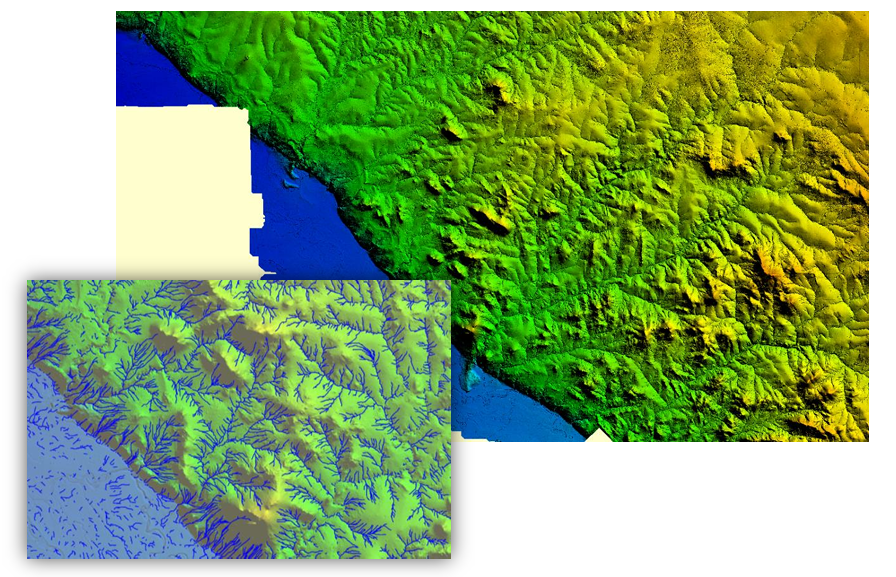
Picture 1: Digital terrain Model for geological structure analysis and drainage lines overlaid for analysis of sinkholes.
The hyperspectral data were processed to mineral maps using principle component analysis, local as well as free available spectral libraries of SAM (Spectral Angle Mapper) and SVM (Support Vector Machine) to mineral maps for the target minerals. The mineral maps were provided combined with quality maps and ready for implementation into the mining package.
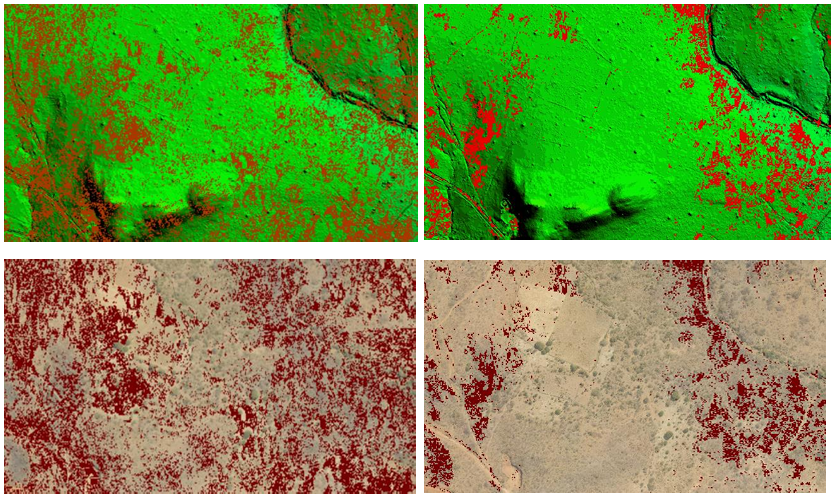
Picture 2: Mineral maps of an area (Granites – upper left, Chlorite – upper right, Calcite – lower left, Pyrite – lower right)
All datasets were combined in Micromine© Software together with existing data from drill programs, petrographic collections, laboratory analysis, and other information.
Mine survey
For the operational mine area, the data were flown to tackle a couple of problems for engineering, planning, and reporting purposes. With new mines opened during the last years and the operational base widening priority was a complete survey of the area using the Lidar and the documentation of the status at the flight time using the orthophoto.
The hyperspectral data were used over the mine area for a couple of topics as there are the analysis of the mine faces using the hyperspectral signatures, the documentation of water leakages along the mine faces, and details of the tailings and dumps.
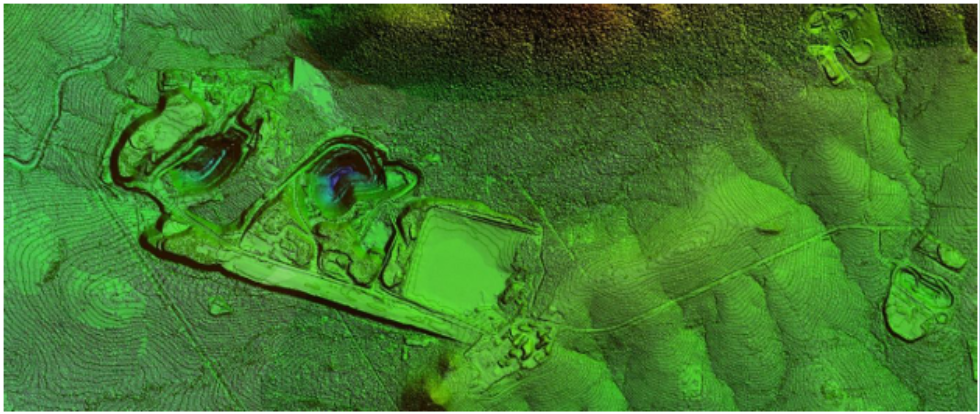
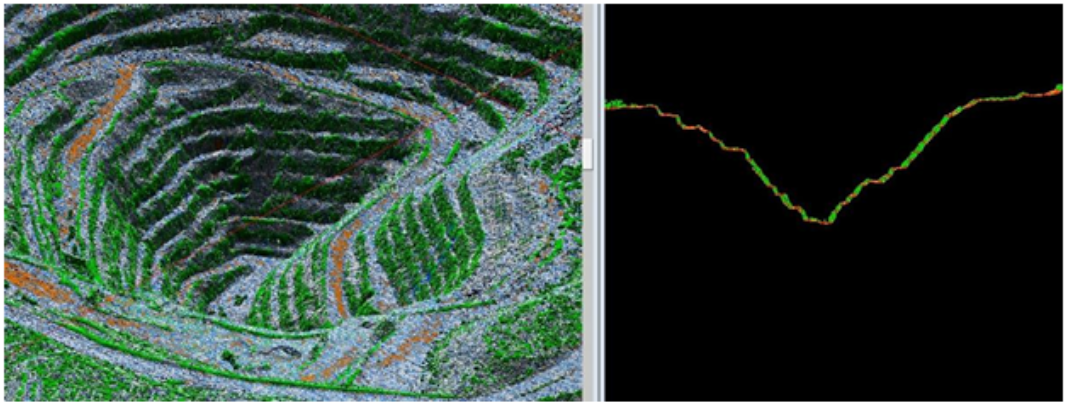
 Picture 3: Lidar-based DTM with contours (top), 3D detail model of the pit and cross-section of the pit (middle), structural analysis of the pit area based on hyperspectral data showing leakages in the pit walls.
Furthermore, the hyperspectral dataset was providing a baseline for the mine operator on the status of the mine to be used in the future for comparison reasons and in case of operational or environmental issues.
Environmental support
While the mine site as well as the exploration area is partly in a state forest reserve and for a wider part in communal forests the Lidar and hyperspectral data were used to analyse the state of the forests. This included the collection of dendrometric data like height and canopy as well as for the state forest also individual tree detection. Based on this measurement and ground data provided by the client from earlier surveys the timber volume and the distribution of the large indigenous trees were plotted.

Picture 4: Distribution of forest in different height classes around the mine site. The data windows show the parameters of an individual tree based on the hyperspectral and Lidar data fusion and the usage of ground plot data.
A further task was the mapping of dust pollution around the mine site and the crusher plant. This is based on the spectral signature of the dust. Together with the mine operator a sample grid was set up to collect ground samples of the dust for laboratory analysis and the hyperspectral data are used to map the extension of the dust plume. The project is ongoing together with external scientists.
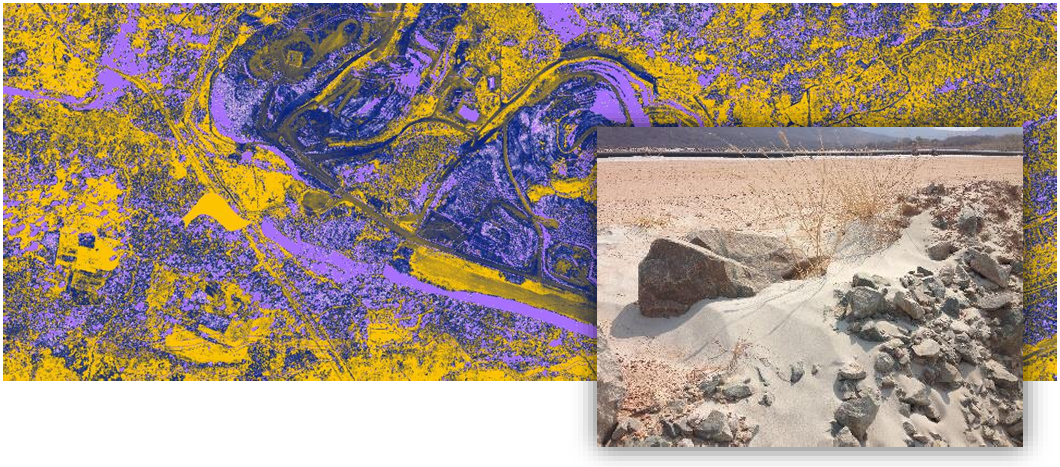
Picture 5: Dust mapping around the crasher site (purple), picture shows dust.
Support social responsibilities
Besides the active mine operation of the client, the area includes also widespread colonial historical and actual artesian mining activities. The heavy metal pollution of this site and the flow of heavy metals in the hydrological system is a major problem for food security and the health of the community in the region. Based on the Lidar and Hyperspectral data and in cooperation with leading academics of the field. The data will be publicly available and will allow concerned parties to remediate long-term the heavy metal danger for the community.
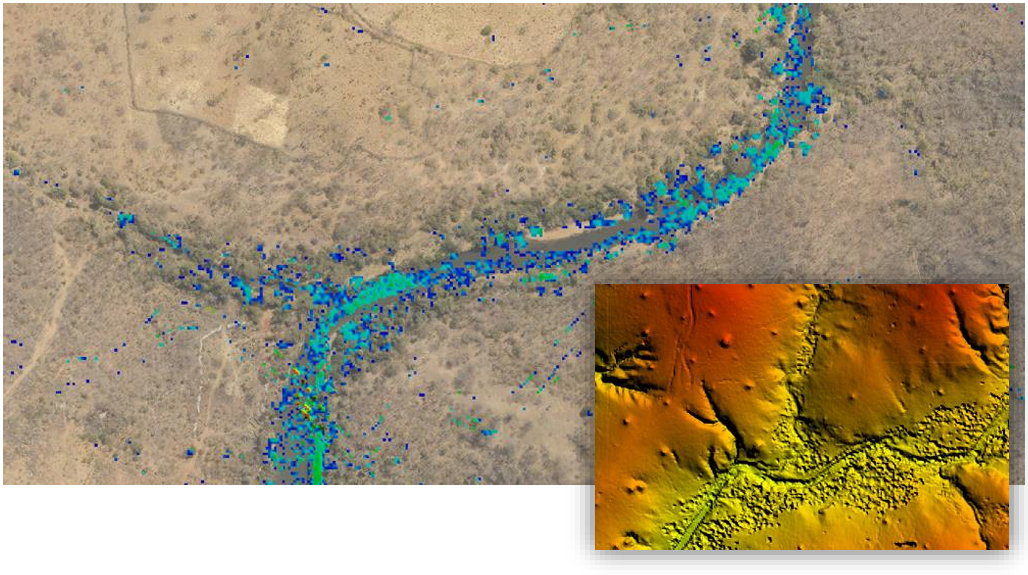
Picture 6: Mapped heavy metal polluting in a river bed based on artesian mining (detected on an extremely fine structure DTM)
While a lot of the data of the survey require the confidentiality property of the mining operator basic topographic data and forestry maps will be provided to the community and local governments in the context of the social responsibility of the mine operator. They can help to develop the community and the cooperation between mining and the community.
Airborne Complex Mine Survey © DIMAP 2016