Separating the bands of light
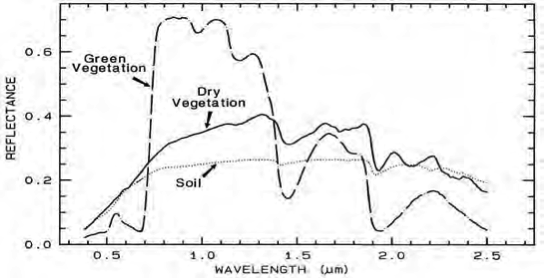
Hyperspectral spectrometers separate electromagnetic radiation via different technologies into narrow wavelength bands, these are recorded as spectrograms. Spectrograms capture the wavelength intensity of each band, these represent the absorption and reflection of electromagnetic energy of different materials. Frames of spectral images are combined into a data cube, each pixel of the data cube can be used to describe the material or material combinations found within the pixel representation of the survey area or laboratory analysis.
Types of Dimap’s scanners
Dispersive Hyperspectral Instruments use different optical implementations and principles to split the incoming light into the different spectral bands (for instance gratings) and to project them onto optical sensitive CCD sensors or arrays. Dispersive instruments are typically used to record data in the visible and near-infrared (VNIR – 400 to 1000nm) but also shortwave infrared (SWIR – 1000 to 2500nm) bands.
Lines are scanned progressively, one after the next, with this system no rotating mirrors are necessary as the complete ground scene width is captured with each scan. This allows the recording of more data in a shorter period which results in a higher spectral and spatial resolution (0.3m resolution and more than 400 bands).
Fourier transformation spectrometer
A Fourier transformation spectrometer can record a complete scene in a single instant rather than a single pixel or line. To achieve this the light is divided into two paths. One path travels via a fixed mirror to the sensor, the second path travels via a mobile mirror which is moved in incremental steps as the sensor array.
The interference between the two paths of light at each mobile mirror location is recorded in interferograms which are then processed with a Fourier transformation algorithm into spectrograms for each pixel of the scene. These sensors are extremely sensitive and allow high resolutions of data extending into the mid-wave and long-wave infrared bands (3000 to 12000nm) combined with extremely high spectral resolutions (up to 800 bands). Due to the long integration times based on the moving mirror and the required stabilizing technology, data collection with these sensors are more costly.
Sample Spectrogram