Case Studies Forestry and Urban Tree Management projects
Forestry Tasmania
Usage of full waveform Lidar in forestry taxation
Objective of the Project:
Forestry Tasmania is Australia’s biggest forestry operator and handles approximately 3.5 Mio ha of plantations and native forests. In 2008 Forestry Tasmania contracted Dimap to fly a test area of 6000 ha with the full waveform Lidar to develop an optimized taxation procedure for the forests using Lidar technology to reduce the taxation costs and get full area taxations with faster turnaround times of the data.
The solution should also provide an additional data layer for other departments like harvesting planning.
Technical Solution:
Dimap applied the Riegl 560 full waveform scanner together with a digital camera to fly the steep mountain terrain in central Tasmania generating more than 4 pts/sqm and an Orthophoto with a resolution of 10cm while forestry Tasmania collected traditional plot data for the different forest structures. During the processing, Dimap provided not only the Images, intensity images, LAS point files, DTM, and DSM but also full waveform data and statistically summarized waveform data describing the forest in more detail.
The ground plot data were then used to calibrate the Lidar data (using synthetic and real waveform data) and calculate top and mean heights, basal area per hectare, and stem volumes with better than 90% accuracy. Furthermore, the segmentation of the forests and additional data layer for the GIS system run by Forestry Tasmania were calculated. The stratification of the forests could be analyzed as well as fuel load as part of forest fire prevention.
Achievements:
The technology allowed Forestry Tasmania to reduce the manual field effort for taxations by 80% and ended in a setup to collect taxation data for the 3.5 Mio ha based on airborne full waveform Lidar within a 3-year project. The technology replaced the classical ground-based taxation approach completely and is established as a standard operation procedure.
During the project, Dimap also found the tallest tree in Australia with over 100m in height.
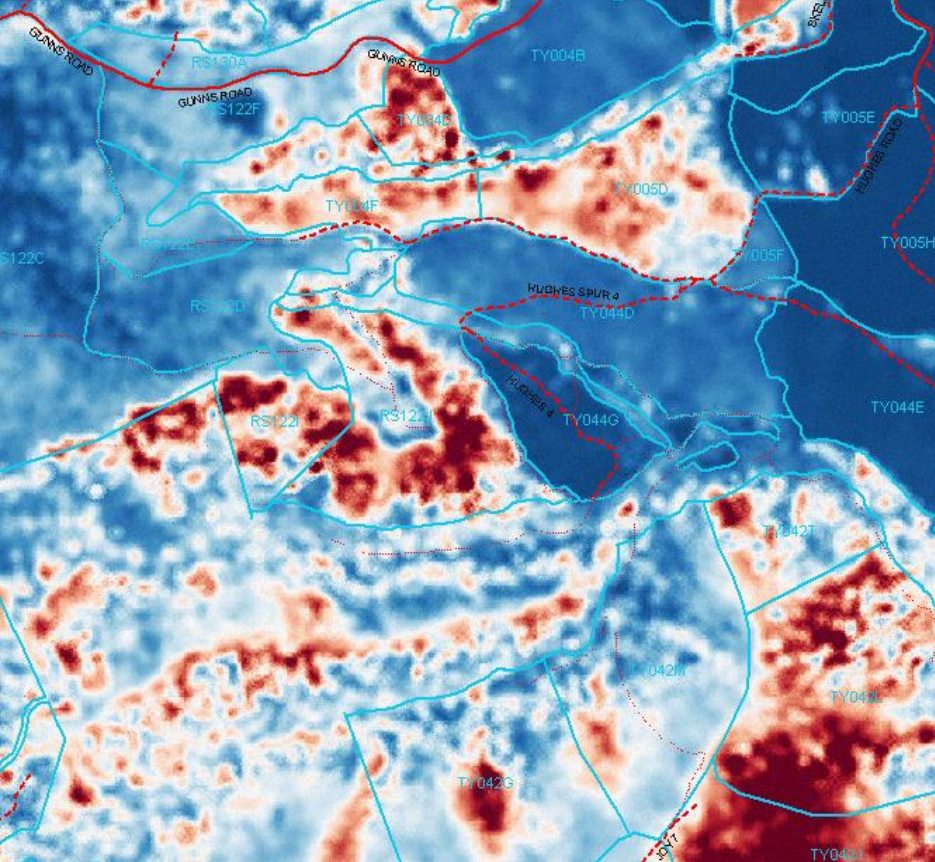 Figure 1: LiDAR-derived metrics used to predict merchantable volume. Volume surfaces (merch vol/hectare) – high spatial precision.

Figure 2: Two views of the same patch – the stratified random sampling approach, and the LiDAR surface-based approach. LiDAR-based timber inventory has resolution at Strategic, Tactical, and Operational levels.
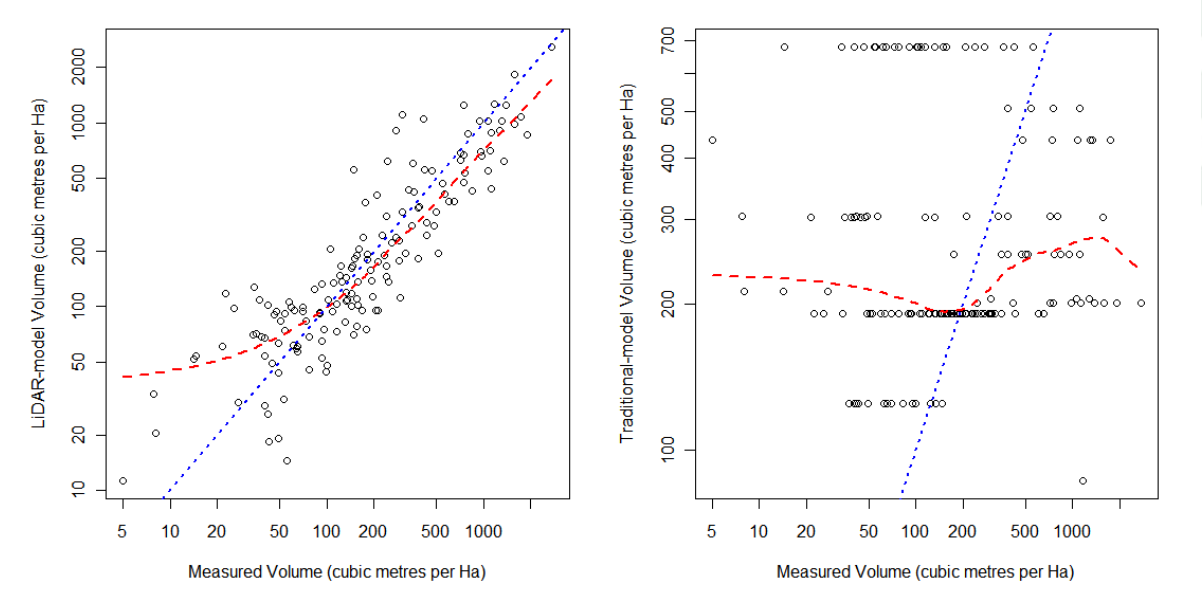
Figure 3: LiDAR volume model predictions vs stratified random sampling derived estimates (plot predicted vs. measured) for native forest development model. The red line is the bias trend.
General comparison with classical photogrammetry approach:
Analyzing publications from Canada, Australia, and Scandinavia and comparing Dimap’s and other Lidar provider results with classical photogrammetry procedure results and ground plots following RMSE can be achieved. One has to note that the errors in forestry taxation using Lidar data depend on the tree species (better RMSE for coniferous and plantations) and that individual tree detections work not on all species and only in the upper strata.
One has also to note that the integration of Hyperspectral tree species detection improves the results of the individual tree detection but also allows the collection of taxation parameters in mixed forests including the implementation of species-dependent BHD-Height-Canopy diameter relationships.
| Parameter | Lidar based on forest stands | Lidar based on individual tree detection min 8pts/sqm | Lidar 4 pts/sqm and Hyperspectral approach | Classical photogrammetry approach |
|---|---|---|---|---|
| Individual tree detection top strata | N/A | 15-25% | 2-15% | 0-5% |
| Individual tree detection second and third strata | N/A | 40-50% | 30-40% | Not possible |
| Number of trees per ha (also species dependent) | 10-15% | 5-20% | 5-10% | 20-30% |
| Species detection | Possible in plantations based on intensity | Not possible | Non-rainforests 5-30% | Limited possible |
| Tree species distribution | Not possible | Limited possible | 100% | 20-30% |
| Mean tree height – absolute | 40-60cm | 20-40cm | 20-50cm | 30-70cm |
| Mean tree height – relative | 5-10% | 5-10% | 5-10% | 10-25% |
| Automatic Canopy diameter top strata | N/A | 20-50% | 10-35% | 10-40% |
| Basal area | 10-15% | 5-15% only plantations | 5-25% Also mixed forest | 20-30% |
| Mean diameter (depending on species) | 10-15% | 10-15% | 10-15% | 10-35% |
| Diameter distribution | Not | 10-20% | 5-20% | Not possible |
| Forestry relevant Volume per ha (tree species) | 5-15% | 5-20% | 5-20% | 15-30% |
| Carbon volume including branches | 15-30% | 10-20% | 7-15% | 20-40% |
© DIMAP 2014